Global Warming Trend Since 1970 (all credits to external source)
Global Warming Trend Since 1970
All credits to the original external source.
There’s something about seeing climate data laid out on a simple graph that makes it feel… real. Not abstract. Not political. Just numbers quietly telling a story.
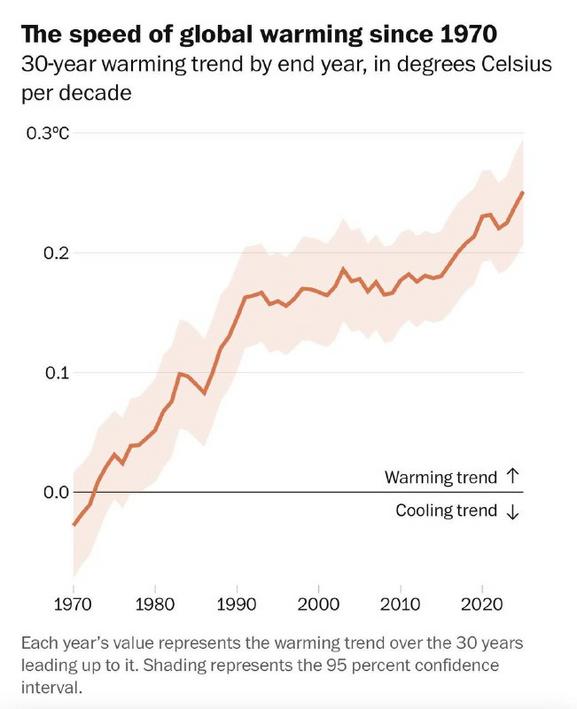
The chart titled “Global Warming Trend Since 1970” shows exactly that. A steady, undeniable rise in global temperatures, measured in degrees Celsius per decade, from 1970 to 2020. And when you follow the line from left to right, you can literally see the acceleration. It starts lower, climbs gradually, then keeps climbing. No sudden drops. No long pauses. Just upward momentum.
What makes this graph especially powerful is the shaded area around the line. That shading represents the 95 percent confidence interval. In everyday language, that means scientists are not guessing. There is strong statistical backing behind the trend. The warming isn’t a fluke year. It isn’t random noise. It’s a pattern that has held up over decades.
If you’re like me, you might remember hearing about global warming in school in the 1990s. Back then it felt distant, almost theoretical. Something scientists were debating. But looking at data that spans fifty years changes that feeling. It connects the dots between then and now. Between classroom discussions and the heatwaves, wildfires, and shifting seasons we experience today.
Since the 1970s, industrial growth, fossil fuel consumption, and rising greenhouse gas emissions have steadily influenced our climate system. And the graph reflects that history in a quiet but firm way. Line by line. Decade by decade.
For policymakers, educators, and environmental advocates, visuals like this are more than just charts. They’re tools for grounding conversations in evidence. For the rest of us, they’re reminders that long term trends matter, even when yearly weather feels unpredictable.
If you want to explore the original visual and context, you can view it here:
Looking ahead, the trajectory is not set in stone. Trends can change when behavior changes. The past fifty years tell one story. The next fifty are still being written, and that part depends on what we choose to do now.


Kommentar abschicken